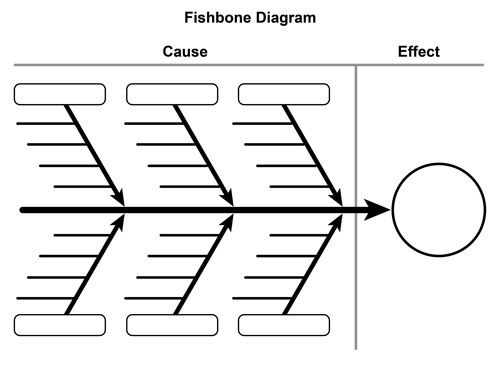
When faced with a problem or challenge, it can sometimes be difficult to pinpoint the underlying causes. This is where a fishbone diagram can be invaluable. This visual tool, also known as a cause-and-effect diagram or an Ishikawa diagram, provides a structured approach to identifying the root causes of a problem.
Its unique structure, resembling a fishbone with branches that indicate causal relationships, allows for a comprehensive analysis of the various factors contributing to an issue.
What is a Fishbone Diagram?
A fishbone diagram is a simple yet powerful tool that helps individuals or teams analyze and solve problems effectively. It provides a visual representation of the potential causes of a problem and helps organize thoughts and ideas in a structured manner. The diagram consists of a horizontal line (the “spine” of the fish) with several diagonal branches (the “bones” of the fish) extending from it.
Each branch represents different potential causes, such as people, machines, methods, materials, measurements, and the environment. By systematically exploring each category and its possible causes, the diagram helps uncover the root causes of a problem.
Why Use a Fishbone Diagram?
The use of a fishbone diagram offers several benefits in problem-solving and decision-making processes.
Here are some of the key reasons why you should consider using this visual tool:
- Identify root causes: The fishbone diagram allows you to delve deep into the factors contributing to a problem and identify the root causes rather than addressing only the symptoms.
- Visualize complex issues: Complex problems can often be overwhelming to analyze. The fishbone diagram provides a visual representation that helps break down the problem into manageable parts, making it easier to understand and address.
- Promote team collaboration: The diagram encourages team collaboration and brainstorming. By involving multiple perspectives, you can generate a comprehensive list of potential causes and solutions.
- Improve problem-solving efficiency: The structured approach of the fishbone diagram allows you to systematically explore different categories of causes, ensuring that no potential factors are overlooked.
- Enhance communication: The visual nature of the diagram makes it easier to communicate complex ideas and findings to others, facilitating better understanding and alignment.
How to Create a Fishbone Diagram
Creating a fishbone diagram is a straightforward process that can be done manually or using various software tools.
Here’s a step-by-step guide on how to create your fishbone diagram:
1. Define the problem:
Start by clearly defining the problem or issue you want to analyze. Be specific and avoid broad statements. For example, instead of stating “low productivity,” you could define the problem as “low productivity in the manufacturing department.”
2. Determine the categories:
Identify the main categories of potential causes that relate to the problem. The classic categories used in a fishbone diagram are people, machines, methods, materials, measurements, and the environment. However, you can customize the categories to fit your specific situation.
3. Draw the diagram:
Draw a horizontal line that represents the spine of the fish. At the end of the line, draw diagonal branches for each category. Label each branch with the corresponding category name.
4. Brainstorm potential causes:
With your team, brainstorm and write down all the potential causes within each category. Encourage open and creative thinking, and try to generate as many ideas as possible.
5. Analyze and narrow down the causes:
Review the list of potential causes and analyze each one to determine its relevance and impact on the problem. Eliminate any causes that are unlikely or not significant. Narrow down the list to focus on the most probable root causes.
6. Identify the root causes:
Based on your analysis, identify the root causes that are most likely responsible for the problem. These causes should have a direct and significant impact on the issue at hand.
7. Develop solutions:
Once you have identified the root causes, brainstorm potential solutions or actions to address them. Consider both short-term fixes and long-term preventive measures.
8. Implement and monitor:
Implement the chosen solutions and monitor their effectiveness. Evaluate the results and make adjustments as necessary to ensure the problem is resolved.
Examples


Tips for Successful Use of a Fishbone Diagram
Here are some tips to help you make the most of your fishbone diagram:
- Involve the right people: Include individuals who have knowledge or experience related to the problem being analyzed. This diversity of perspectives can lead to more comprehensive problem-solving.
- Encourage open communication: Create a safe and collaborative environment where team members feel comfortable sharing their ideas and opinions.
- Be specific and objective: Clearly define the problem and focus on identifying the causes rather than jumping to solutions prematurely.
- Use data and evidence: Support your analysis with data and evidence whenever possible. This adds credibility to your findings and helps prioritize the most critical causes.
- Continuously improve: Don’t consider the fishbone diagram as a one-time tool. Use it as part of an ongoing improvement process to address problems and identify opportunities for optimization.
In conclusion, a fishbone diagram is a valuable visual tool that helps identify the root causes of problems. By providing a structured approach and promoting team collaboration, this tool enables effective problem-solving and decision-making. By following the steps outlined in this article and considering the tips provided, you can leverage the power of a fishbone diagram to analyze and solve complex problems systematically and efficiently.
Blank Fishbone Diagram Template – Download
